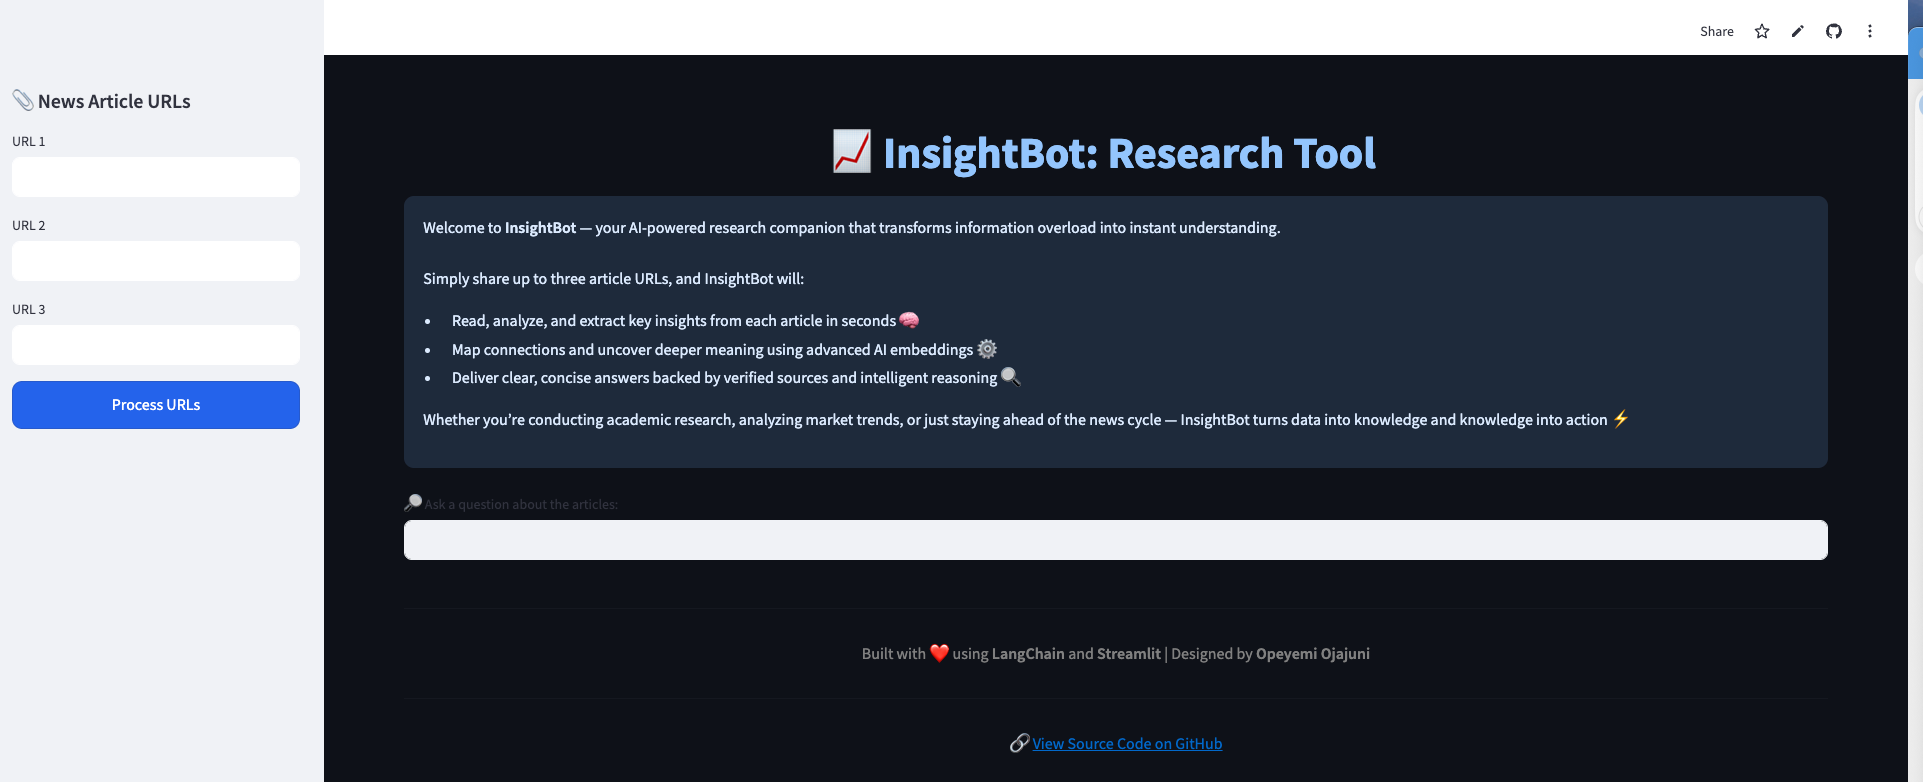
InsightBot β GenAI research assistant
Production RAG pipeline over a user's article corpus. LangChain + FAISS + GPT deliver citation-backed synthesis in seconds instead of hours.
14 systems across applied AI, data science, and extended reality β from GenAI RAG pipelines and supply-chain forecasting at Amazon to federally-funded VR training platforms, live Streamlit dashboards, and peer-reviewed studies. Each one framed by a real-world problem and measured by the outcome it delivered.
Production RAG pipeline over a user's article corpus. LangChain + FAISS + GPT deliver citation-backed synthesis in seconds instead of hours.
LLM-backed safety assistant with responsible-AI guardrails, built in AWS PartyRock as a sandbox for campus-scale GenAI and future VR integration.
Built an immersive crisis-response training platform combining a LiDAR/GIS digital twin of Baton Rouge with AI-driven scenario generation. Runs on Meta Quest 3 and a CAVE. Partnered with the Louisiana Department of Health; trained 35+ public-health and emergency-response leaders across 10+ scenario modules.
City-agnostic pipeline turning OSM/ArcGIS data into interactive 3D digital twins. Deployed in CAVE and Meta Quest 3 for smart-city planning.
Developed immersive VR science modules across HMD and CAVE environments, integrating UX research and usability evaluation into a full research-to-product lifecycle, supported by professional development for STEM educators to ensure effective deployment.
Cohort study linking VR UX factors to learning outcomes. Triangulated focus groups, surveys, and in-class observation across cohorts.
Data-scientist internship on Amazon's fulfillment team. Built the data transformation framework and statistical models predicting storage capacity β adopted and run by the team post-internship.
Interactive Streamlit dashboard exploring 2000β2024 global HIV/AIDS data β infections, ART coverage, demographics, and the UNAIDS 95-95-95 cascade across 150+ countries.
Random-forest classifier predicting academic risk across 15 engineered features; wrapped in a Streamlit app and deployed for advisors. Enables earlier intervention for students trending off-track.
TensorFlow/Keras ANN regressing on the King County housing dataset. Interactive scenario testing deployed live on Streamlit Cloud.
SVM, KNN, Random Forest, and XGBoost applied to CT survey items. Ablations confirmed algorithmic and creative thinking as dominant predictors.
Factor analysis and SEM establishing a research-grade instrument for CT measurement in VR learning, cross-validated across cohorts.
Controlled pre/post experimental study measuring CT gains from VR learning. Non-parametric tests confirmed significant effects across skills.
ARIMA time-series forecasts of minority graduate supply vs. workforce demand. Scenario testing and CIs guide equity-driven recruitment policy.
I built InsightBot because literature review was eating entire afternoons. It's a production RAG pipeline that ingests a user's article corpus, indexes it in FAISS, and serves citation-backed synthesis over the top via an LLM β so every answer is traceable to the original source in seconds instead of hours.
WebBaseLoader pulls article text; a recursive splitter handles long documents cleanly without losing context.
OpenAI embeddings stored in a local FAISS index for fast, semantic retrieval over the full corpus.
RetrievalQAWithSourcesChain grounds every answer in the original passage β no source, no sentence.
Campus safety tools are often static PDFs and posters β no help in the moment. I built SafeGuide as an LLM-backed assistant that helps students, faculty, and staff reason through risky situations (intoxication, harassment, unsafe environments) with responsible-AI guardrails, plus a sandbox for future VR integration.
Users describe a situation in plain language. The assistant asks clarifying questions without judgment.
A PartyRock-hosted prompt enforces safe, non-judgmental, resource-aware guidance for every response.
Returns clear steps and campus resources to call β so people leave with a concrete move, not anxiety.
Traditional crisis drills don't capture the chaos of a real incident. ICLERT does: an immersive training platform combining a LiDAR/GIS digital twin of Baton Rouge with AI-driven scenario generation, running on Meta Quest 3 and a CAVE. Built in partnership with the Louisiana Department of Health to train public-health and emergency-response leaders across 10+ scenario modules.
LiDAR + GIS layers reconstructed key Baton Rouge sites in Unity at survey-grade fidelity.
AI-driven scenario engine varies events, NPC decisions, and constraints to keep training adaptive.
In-headset telemetry captures decisions and response time; tied back to learning-outcome instruments.
Static 2D maps lose spatial nuance. I built a city-agnostic pipeline that turns OSM and ArcGIS data into interactive 3D digital twins rendered in CAVE and VR. It's a foundation for smart-city planning, disaster-resilience review, and public engagement with urban systems in ways paper maps can't deliver.
OSM + ArcGIS geospatial data imported with local-origin referencing for sub-meter precision.
CityEngine generates 3D city blocks from footprints β fast iteration across neighborhoods.
Unity builds ship to Meta Quest 3 and multi-user CAVE; usability studies validated realism.
Under-resourced classrooms rarely see immersive tech. SURADD is a multi-user VR environment for middle and high school STEM where students explore molecular and physical systems collaboratively while educators run guided sessions. I measured engagement and retention against traditional instruction in a mixed-methods study.
STEM educators and researchers co-designed modules aligned to middle-school curricula.
Unity + Meta SDK for delivery across HMD, CAVE, and Mobile CAVE β wherever the classroom is.
PD workshops for teachers paired with mixed-methods evaluation of engagement and retention.
Before scaling up any immersive curriculum, I wanted real data on what actually works in a headset. This is a cohort study linking VR UX factors to learning outcomes β triangulating focus groups, surveys, behavioral metrics, and in-class observation to measure presence, workload, and cognitive load.
In-class observation with behavioral coding β what students actually do once the headset is on.
Standardized presence, NASA-TLX workload, and usability scales captured quantitatively.
Triangulated themes inform headset setup, session length, and interaction-pattern choices.
Built ML and Statistical models on 1M+ supply chain events and 10M+ order histories to forecast storage and sort capacity under peak demand. Built the data transformation framework and statistical models that forecast storage capacity requirements, shortening the capacity-planning cycle.
Built scalable ETL and data transformation pipelines for 1M+ events and 10M+ orders, enabling reliable forecasting and simulation workflows.
Benchmarked seasonal-naive, ARIMA, and gradient-boosted regressors with rolling-origin cross-validation.
Documented the framework, integrated into the team's planning notebook, and continued running post-internship.
Global HIV/AIDS data is scattered across UNAIDS, WHO, CDC, and World Bank β hard to explore, harder to compare. I built an interactive Streamlit dashboard that unifies 25 years of data into one lens: new infections, ART coverage, demographic gaps, and progress toward the UNAIDS 95-95-95 cascade across 150+ countries.
Ingested and harmonized 25 years of UNAIDS, WHO, CDC, and World Bank data with pandas β cleaned country codes, aligned time series, and reconciled indicator definitions.
Built 6 interactive Plotly pages β global trends, regional breakdowns, demographic gaps, ART coverage, 95-95-95 cascade progress, and country deep-dives.
Auto-generated narrative callouts highlight the biggest gaps and wins per view, so policy users get the headline before they drill in.
Advisors needed a risk signal earlier than midterms. I built a random-forest classifier on 15 engineered features, wrapped it in a Streamlit app, and shipped it to the cloud so any advisor can get a risk score with one-click rationale. Validated on 1,000+ student records.
15 features across academic history, attendance, course load, and demographic indicators.
Benchmarked logistic regression, SVM, and Random Forest with cross-validation; RF won on F1.
Streamlit interface deployed to the cloud for advisors to query risk scores with one-click rationale.
Manual appraisals are slow and miss the non-linear interactions that actually drive price. I trained a TensorFlow/Keras ANN on the King County dataset and wrapped it in a Streamlit app so anyone β even non-technical buyers β can adjust 18 property features and see an instant prediction.
Cleaned and MinMax-scaled the 2014β2015 King County data; dropped noisy fields.
ANN in TensorFlow/Keras tuned for regression with hold-out validation.
Streamlit Cloud deployment with GitHub version control β users adjust features, see predictions instantly.
Computational thinking (CT) is a moving target for educators β which skills actually drive proficiency? I benchmarked SVM, KNN, Random Forest, and XGBoost on CT survey items and performance tasks, then used ablation studies to surface algorithmic and creative thinking as the dominant predictors.
Survey items and performance-task scores encoded for modeling with consistent preprocessing.
SVM, KNN, Random Forest, and XGBoost benchmarked with k-fold cross-validation.
Feature-importance + ablation studies identify the cognitive drivers that matter for instruction.
Any measurement claim about CT needs a defensible instrument behind it. I ran a psychometric validation that trimmed 29 observed variables to 5 latent constructs via EFA and PCA, then confirmed factor structure and model fit with SEM β producing a research-grade instrument for CT measurement in VR learning.
Exploratory factor analysis and PCA reduce 29 variables to 5 interpretable constructs.
Structural equation modeling confirms factor structure and evaluates overall model fit.
Results reproduced across cohorts to establish reliability and generalizability.
Does VR actually move cognitive outcomes, or just feel engaging? I designed a controlled pre/post experimental study with validated CT instruments. Non-parametric tests confirmed significant effects on algorithmic reasoning and creative problem-solving, with subgroup analyses across demographic variables.
Randomized controlled pre/post with validated CT instruments across matched cohorts.
Shapiro-Wilk normality, Mann-Whitney U, Wilcoxon signed-rank, and independent-samples T-tests.
Effect sizes + subgroup analysis point to where VR delivers the strongest returns.
Equity plans often rely on guesswork. I built ARIMA time-series forecasts of minority graduate supply versus workforce demand, with scenario testing and confidence-interval analysis β giving universities and employers actionable numbers to close representation gaps.
Cleaned and aligned education-to-industry time series with consistent taxonomy.
ARIMA with full model diagnostics and multi-scenario testing against history.
Confidence intervals translated into recruitment, scholarship, and hiring-practice recommendations.